
Oyster Catcher
During year 2 of my undergrad, I took on a UROP (undergraduate research post) to develop a data logging unit to capture the shell ‘gaping’ activity of edible oysters to attempt to identify spawning behaviour and thus aid conservation efforts of the species, the project being a partnership project between University of Essex and Colchester Oyster Fisheries. I worked on the project from late 2016 until mid 2018, essentially until I completed the coursework for my bachelors degree.
 The
first proof of concept
The
first proof of concept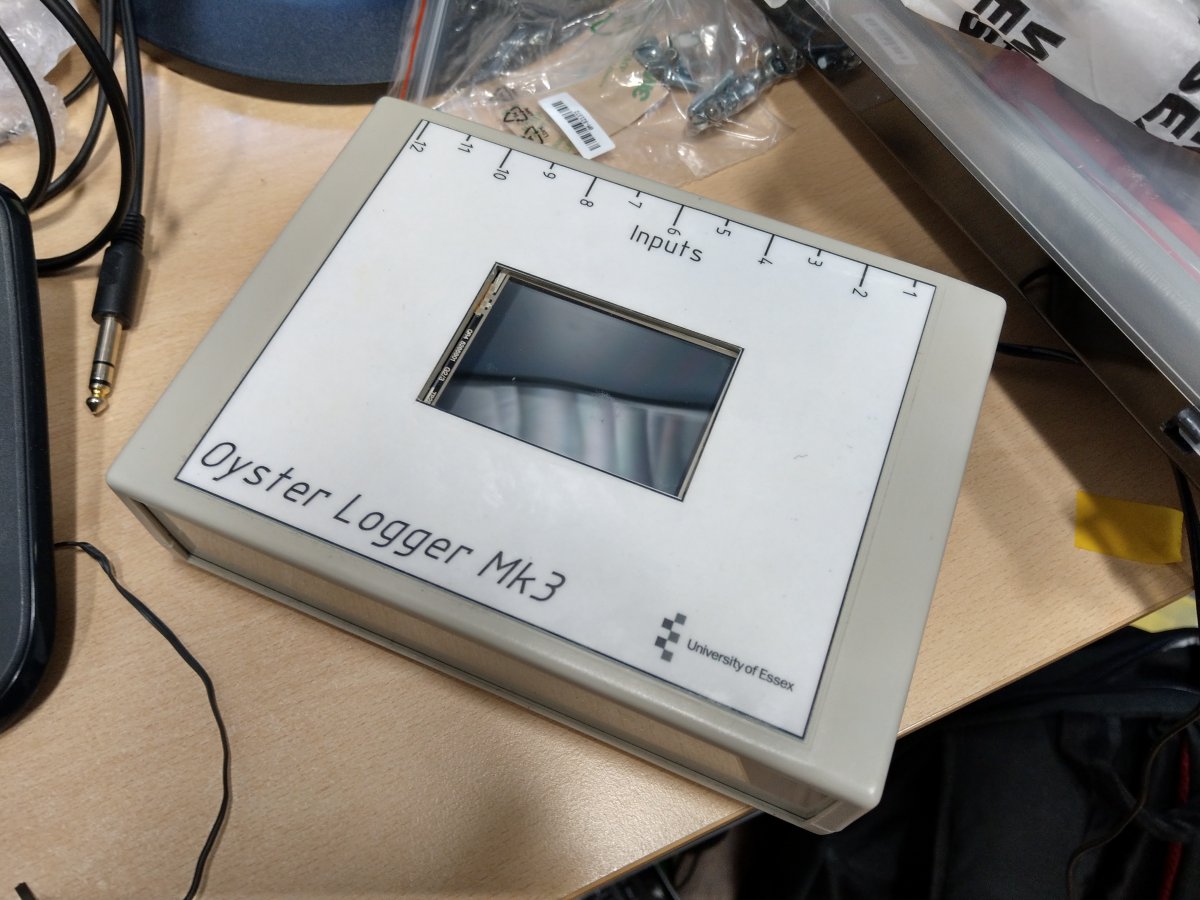 The
3rd generation unit
The
3rd generation unit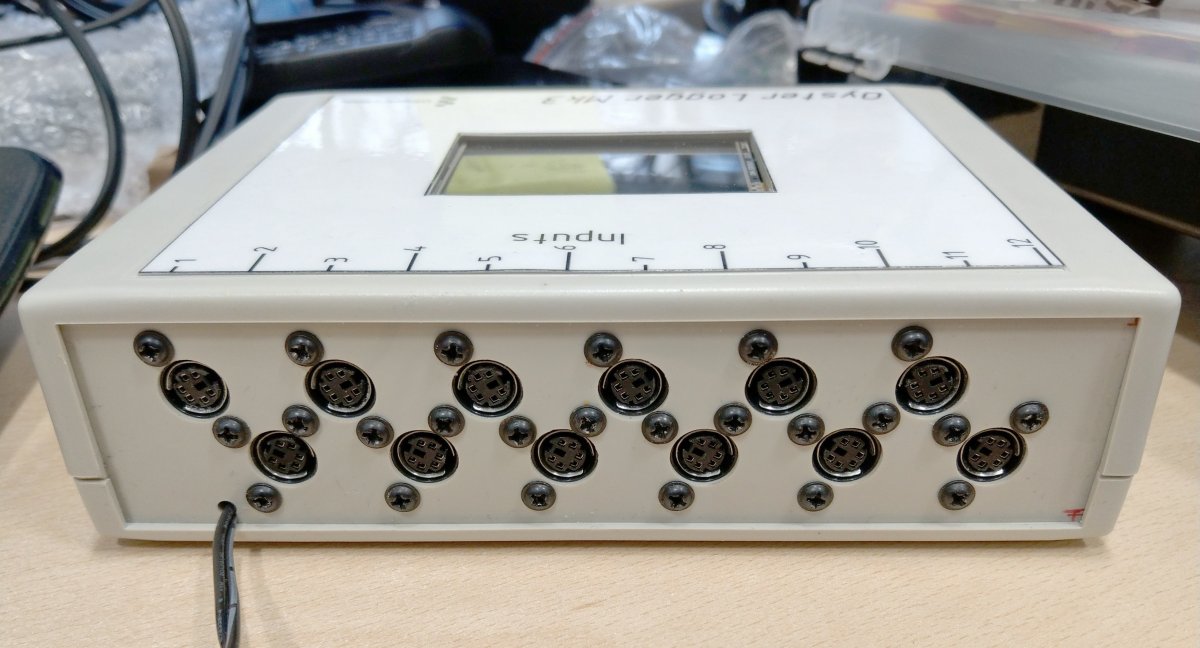 Input panel of the 3rd gen unit. Miniature DIN
connectors to keep costs at a minimum
Input panel of the 3rd gen unit. Miniature DIN
connectors to keep costs at a minimum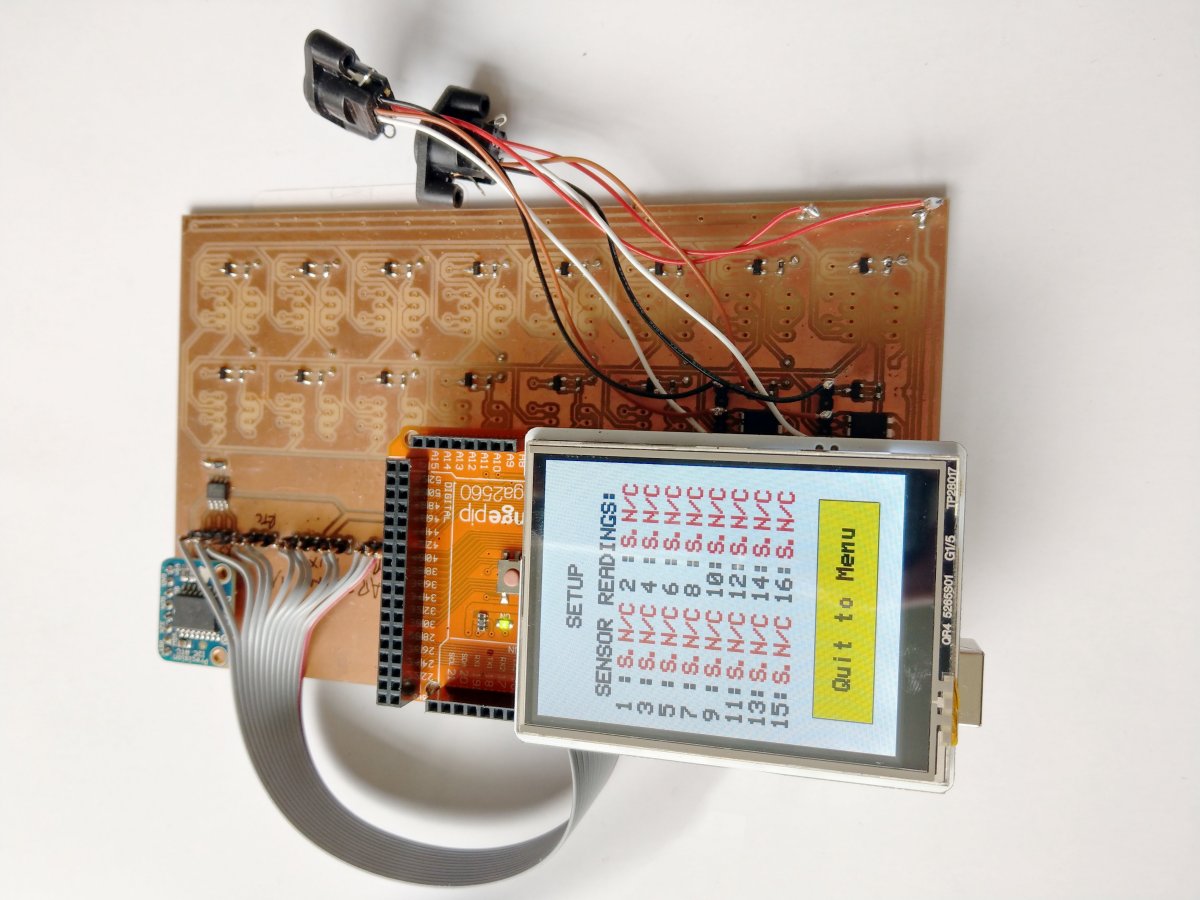 Prototyping
the 4th gen version. The device is now intelligent enough to show
at a glance if a sensor is disconnected or possibly faulty
Prototyping
the 4th gen version. The device is now intelligent enough to show
at a glance if a sensor is disconnected or possibly faulty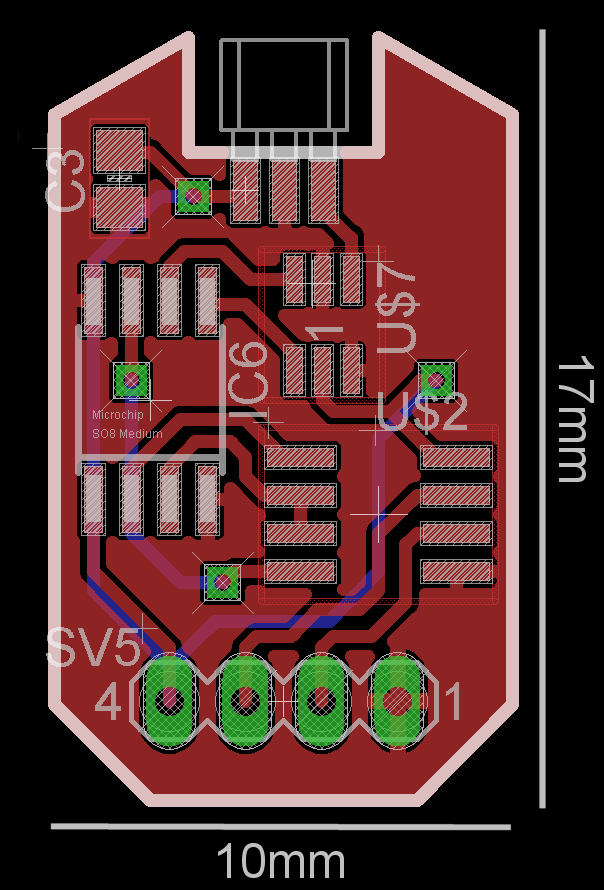 PCB design for the sensor 'head' module for the 4th gen
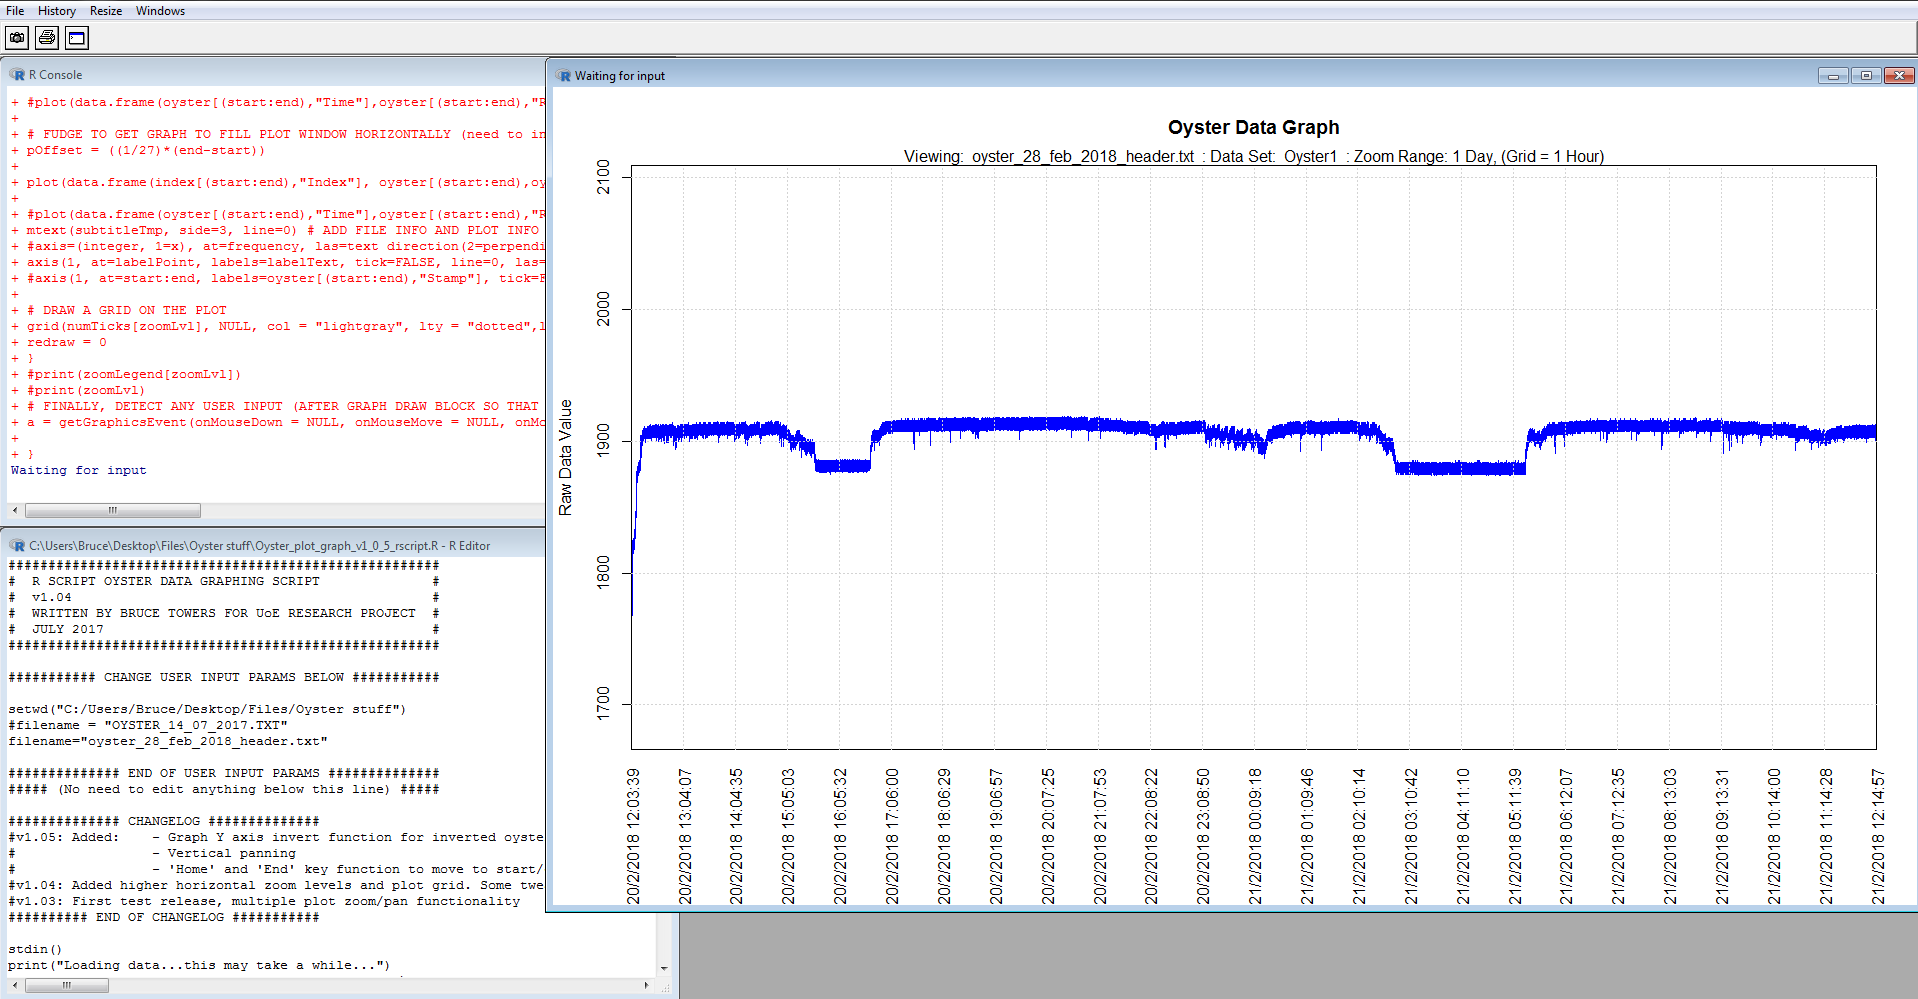 Screen
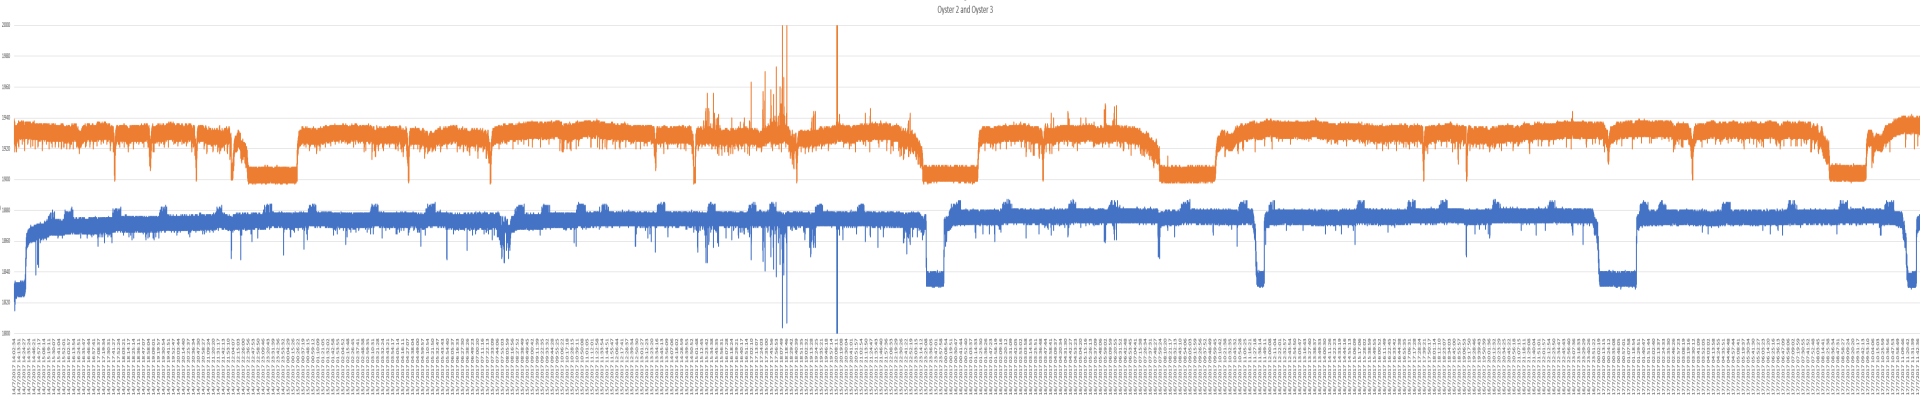
grab of the R Script GUI in actionNoise spikes showing a large thunderstorm passing
overhead on the evening of the 15th July 2017
Screen
grab of the R Script GUI in actionNoise spikes showing a large thunderstorm passing
overhead on the evening of the 15th July 2017In a nutshell, the project deliverable was a unit which could connect to a group of oysters and capture their life cycle activity in real time, saving this data to memory for later retrieval. The monitoring device would have to be fixed to the oyster by a non-invasive method so as not to cause any possible harm, we chose hall effect sensor and magnet pairs, attached to opposing sides of the oyster's shell with an inert putty. I handled virtually all development and manufacture myself, meetings with my supervisor being concentrated on discussing the roadmap of future ideas and features.
I want to mention at this point that I am no longer involved with the project; I did have the chance to continue but decided to move on, and as far as I know it's now being worked on by another researcher. The reason I mention this is that in late 2018 the project gained some widespread media attention (the first I knew of this was sitting in traffic one evening and hearing one or our academic staff interviewed about the project on BBC Radio 4..), and although I'd like to think that its current success is at least in some small part due to my input, it's up to someone else to take the credit now.
The project was a solid success and went on to form the basis of my bachelor's final project which scored me a 1st.
Project evolution
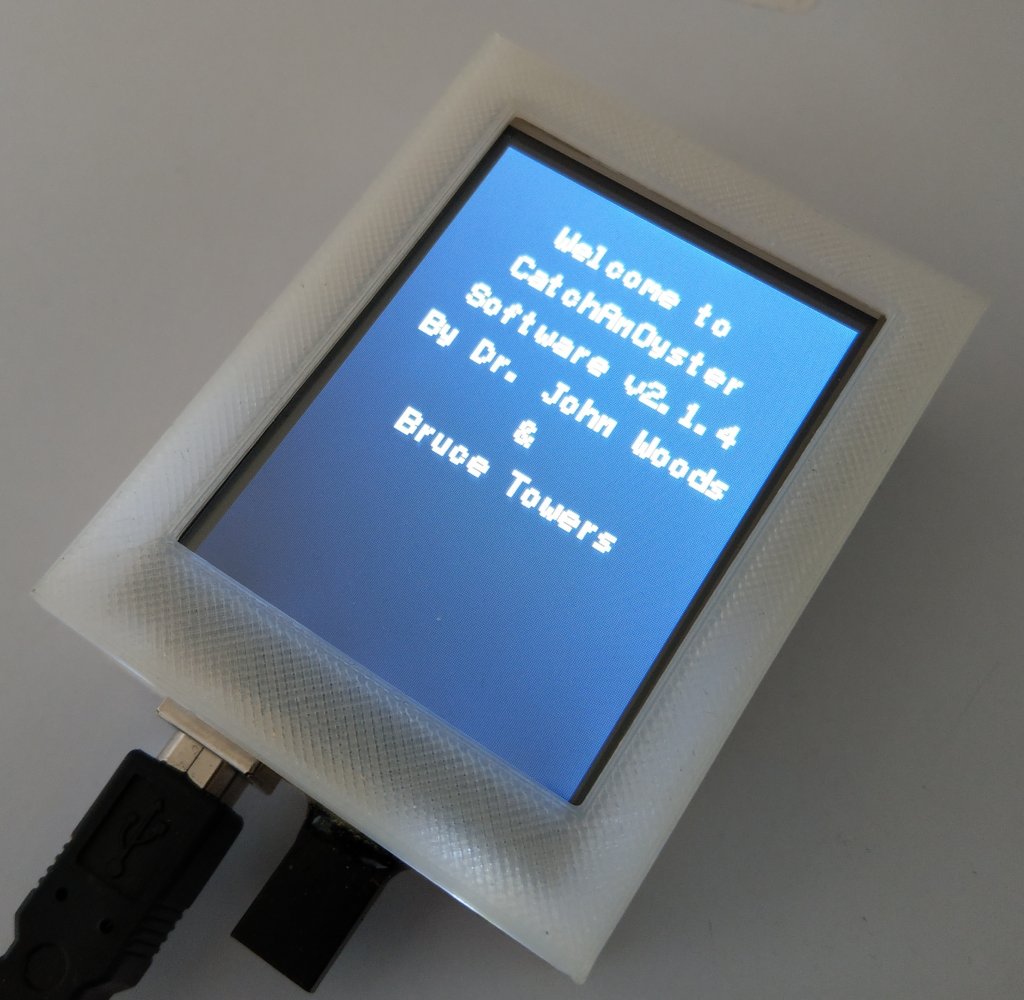
I evolved the unit over four versions, ranging from the original, simple, proof of concept, to a final version which featured real-time data recording, support for 12 subjects, rugged digital communication (via RS-485) and intelligent detection and isolation of any faulty sensors (sensor failures in the hostile environment were always going to be a possibility, even if professionally manufactured). Essentially, the unit evolved jointly in response to problems encountered and desired features, with core specifications also being improved along the way - for example, power consumption was gradually reduced, with sensor conditioning and resolution improved.
Development was very low key. Hardware units were assembled in my garage, with parts such as enclosures laid out in CAD and machined on my miniature CNC mill - although this was solely a research project, I always strive to end up something which looks like a factory manufactured end product. Parts such as sensors were assembled in batches, encapsulated with epoxy and then soak tested (literally, for 48 hours in a bucket of salt water) in an attempt to weed out faulty components.
My roadmap was to stay with rapid prototyping (Arduino based) until we had a stable foundation which we were able to scale, then gradually move to custom hardware. The advantage of Arduino was that it enabled features to be added and removed almost at whim, with the added advantage that any faults could be simply and cheaply resolved by simply swapping a board.
The downside, as became ever more apparent as the project progressed, was that as I added features to the Arduino, incompatibilities crept in; one example being that noise started appearing on the analogue sensor inputs, this eventually being traced to an interaction with the SPI writes to the touchscreen. This spurred me on to gradually distribute features off-board, as evidenced in the final 'Mk4' version of the device - this used discrete 16 bit analogue to digital converter blocks, with the Arduino 'core' being gradually pared back to core UI and data writing functionality as more sensitive sections were separated.Early testing took place in a lab environment, where the units were proved and any problems were simple to resolve. We later moved to field trials which took place about a mile from shore in the Colne estuary, with the units being left unattended for up to 2 weeks at a time. Access was difficult, requiring arrangement with the fisheries staff, this underlining the importance of my confidence in the device by this stage as we were essentially taking up the fisheries staff work time.
The main problem I faced was power consumption, which improved greatly through some imaginative coding to enable the unit to operate with short bursts of activity followed by relatively lengthy sleep periods, and modifications to existing components (such as modifying the touchscreen controller to be switchable by means of inactivity timeout). To illustrate this reduction, the first version of the unit consumed around 900mW to monitor just one subject, yet by the end of the project I had reduced this to an average 200mW to monitor 12 subjects (~16mW per subject), while preserving more functionality. Further development of the system would have reduced this further.
Data analysis
The field trials were a broad success and returned more data than we were able to process through our existing tools. As an example, we sampled at 2Hz and this would return 173,000 data samples per 24hr period, per oyster subject. Multiply this by several subjects over a trial lasting often more than 7 days, it wasn't uncommon to download a set of data containing 10's of million samples and viewing this bulk of data in anything approaching real time was impossible in the likes of Excel, or even MATLAB without extensive processing.
In response I developed a data analysis interface in the R scripting language, dynamically loading slices of data from RAM as required. Again, I developed the plugin in response to desired functionality, adding features such as independent horizontal and vertical data panning and zoom, the ability to invert data sets (in the early days, sensors were occasionally fixed to subjects backwards, reversing their readings) and fast switch between subjects to compare activity while preserving their individual zoom levels, while still being able to pan and zoom the data fluidly.
We also inadvertently caught some external events in the data in our time recording in the field, including an old fishing boat with a faulty noise suppressor which would pass through the area every few days and cause spikes of noise for 90 seconds or so, confirmed by looking at shipping logs for the area each time the noise occurred on the data, and one of the biggest summer thunderstorms that year, confirmed by looking back at the satellite weather forecast.
